
Replace Power BI Alerts with Power Automate Alerts for SQL Server Data
/If you’ve use Power BI for a bit, you have probably realized you can create alerts that will email you when a value hits a certain level, or you can use Power Automate to handle the alert and trigger a workflow that will do whatever you want. You can read more about that process here if you like, but the basic procedure is:
Create a Card visual in your report. This works with a Gauge visual too.
Publish your report.
Pin the card to a dashboard.
Go to the tile in the dashboard, select the ellipses menu, and select Manage Alerts
Set your alert as desired, or click the Power Automate link at the bottom to start a workflow.
That is all fine and good, but if your data is in SQL Server, you can avoid creating the report and generate the alert within Power Automate. What I am going to show you how to do is create an HTML table and then send that data to a user in Teams. Why would you want to do that though? A few reasons:
It is one less report to publish an maintain.
You have to add the visual to a Dashboard for alerts to work.
To do anything fancy with the alert, you still have to use Power Automate, so Power BI here is extra work to create and maintain.
The type of alert this is ideal for is when if a query has records, there is something wrong and needs to be dealt with. Examples:
Number of orders past due
Number of inventory items with negative quantities
Number of invoices for customers with past due amounts
I’m going to show you how to do this in Power Automate with just a few steps. Let’s get started. In my example, I am going to return a table when a customer has placed an order where the order quantity will not divide evenly into the case pack. So if they order 100 units and the cases contain 24 each, I want to alert the order entry person to tell them the customer has effectively ordered 4.1667 cases, which isn’t allowed. They will need to order either 96 units or 120 units to get 4 or 5 cases.
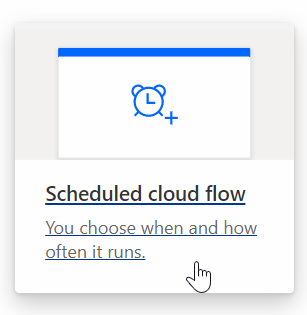
1) You need to create a new flow, and it should usually be scheduled. That is the easiest to deal with. So navigate to Power Automate in your Office 365 portal and add a new Scheduled Cloud Flow.
Just put anything in the opening box it shows and click next. One there, you will see a Recurrence bar. Click that and it will look something like this.

Here you set how often it happens. Above shows this will run every day in the Pacific time zone at 8:15am, 12:15pm, and 4:15pm. This dialog box is dynamic, so if you change Frequency to Week, a list of days will also show up, so you could tell it to run only on Monday, Wedneday, and Friday for example. Save when done.
2) Add the SQL Server Power Query connector. Search for Power Query and you should see results similar to below. Even though Power Query in Excel and Power BI can access a wide variety of sources, in Power Automate, we are currently limited to SQL Server.
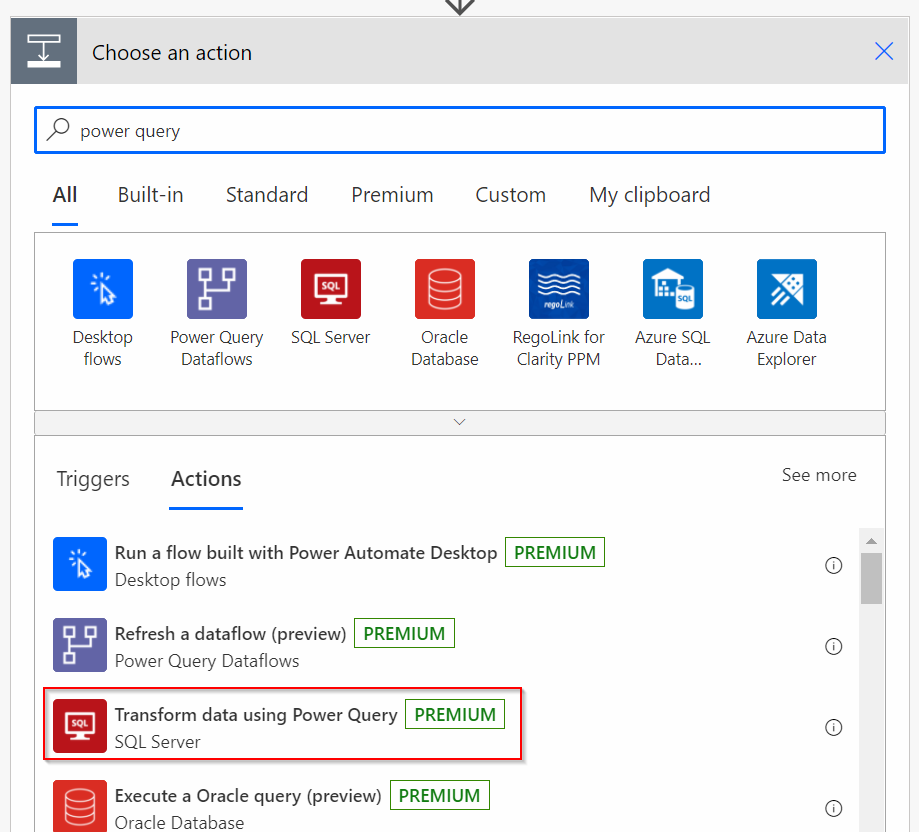
Click Transform Data using Power Query. You’ll note that it is a premium connector. This means you need the appropriate Power Automate license. You might already have it based on your Office 365 subscription. You can read more here on licensing.
Now, at this point, click Edit Query create do your query. You should see a list of tables in your SQL database. Select as many as are needed to get the result you want. I am assuming your have a connection to a gateway. Setting up gateways and connections goes beyond the scope of this article.
I will say that the online query editor is pretty good, but if you are editing multiple queries, sometimes the UI just returns an error. I’ve always been able to fix that by saving the query, then going back in. If you are good with M code, you can do most of your transformations in Power Query in Power BI, then copy the relevant M code to Power Automate’s Power Query using the Advanced editor.
Note that you can connect to multiple tables and perform merges, appends, groupings, etc. The key to remember is you must have one and only one query that has “Enable Load” checked. This is your final query that will return the number of records you need to alert your users to, or will return no records if there are no problems.
Now is where the fun begins. Power Query has returned some data, so how do we get that info to the end user?
3) Add a new step and search for the Compose action. We want Compose-Data Operation action. Here we will count how many records Power Query returned. Sadly, this is not as simple as you would think. Here is what you do:
3a) In the Compose box will be an Inputs field. Click in that and the Dynamic Content/Expression editor will open up.
3b) In the expression box, type length(). The length() function is how Power Automate counts rows. It isn’t RowCount like in Power Query or COUNTROWS like DAX, but it does the same thing. Just like Power Query on your desktop, it is case sensitive, so it length, not Length or LENGTH.
3c) Click inside the parenthesis, then go back to the Dynamic Content tab and select the body/value object. Do not click body. It must be body/value.

In the image above you’ll notice I have been renaming my steps. II recommend you do this as well so you can tell what each step is really doing. You can do this via each step’s ellipses menu. Your final formula should look like this, depending on what your SQL Power Query step is named.
length(outputs('Get_Shipments_Out_of_Case_Pack')?['body/value'])
When you clicked on the body/value object, it created the outputs('Get_Shipments_Out_of_Case_Pack')?['body/value'] code. Whatever you named the Power Query step is what will be between the single quote marks, and all spaces replaced by an underscore. The length() function around it will return an integer for the number of records in the table. If there are no records, it will return zero.
4) Now we need to decide what to do with this table. In our example, 0 records is good, 1+ is bad. So we need to create a condition to do nothing if the result is 0, or send an alert if there are one or more records. So let’s add a new step and look for the Condition step.
In the Choose Value box, select the Outputs step from the RecordCount step in the Dynamic Content window - assuming that is what you renamed the purple Data Operation step. Then set your filter as desired. Here it is simply greater than 0. If it is greater than 0, then the steps we add to the green If Yes box will run. If it is 0, the steps we add to the orange If No box run.
Notice in the Condition box is an Add button. You can add more conditions and use all kinds of AND/OR logic here. It can be quite powerful.

For the If No box, we will do nothing. Just leave it empty. If there are no records, the flow will simply end.
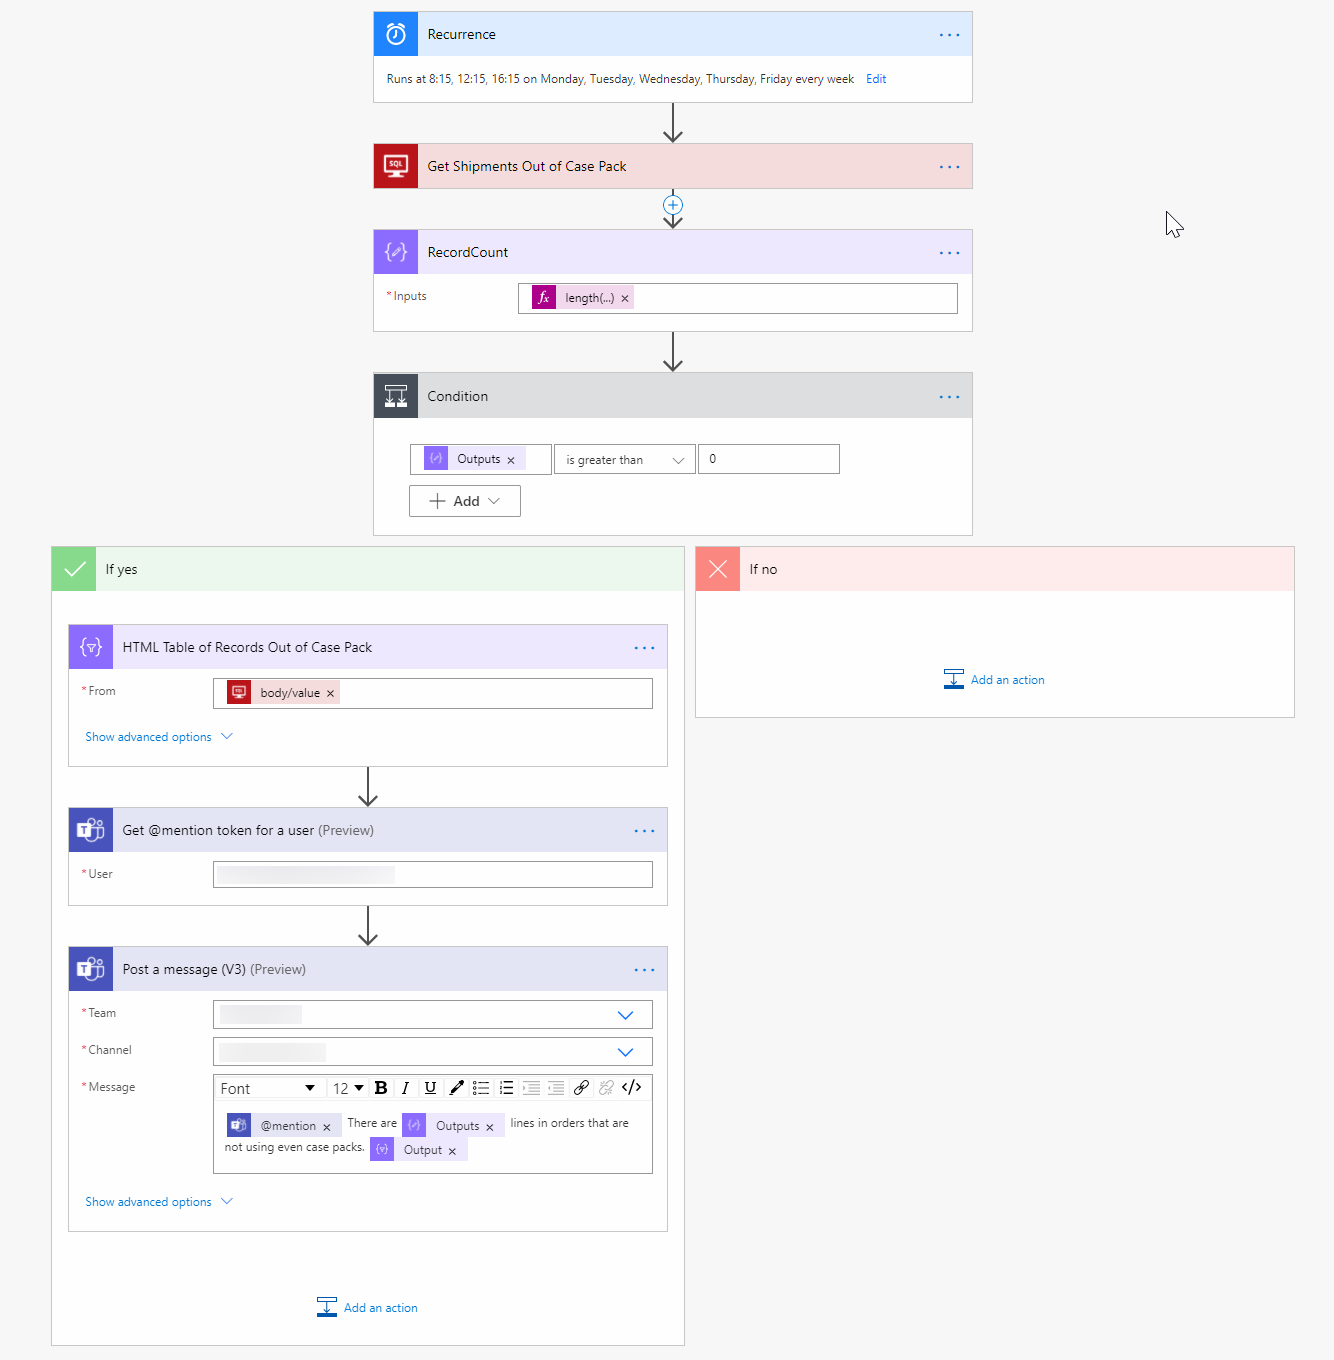
For the If Yes box, we need a few more steps to get that data into a table and to Teams. Here is what that If Yes box will ultimately look like for this flow:

5) Add a step to the If Yes box by looking for the HTML table operation. In the From field, click on the same body/value object from the Dynamic Content for your Power Query data.
6) Add a Teams @Mention token action. This will allow Power Automate to mention that user. Unfortunately there is no way currently to mention a channel or team. If you need to alert multiple users, just keep adding a new @mention token for each. I strongly recommend you rename each step to include the users name so you don’t have 3 boxes, for example, that just say “Get @mention token for user/user2/user3.” In the user field of the @mention step, just put the user’s email address.
7) Now to send it to Teams. Get the “Post a message (v3)” action. This will post a message to the team and channel of your choosing as a post.
Select the Team and Channel from the dropdowns, then in the message compose your message. Here I am mentioning the user. Then I tell them how many records were returned by selecting the Outputs object from the RecordCount operation. Finally I return the table itself by selecting the Output object from the HTML table operation.
That’s it. The final flow might look like this:
Now, if you play around with Power Automate, you will find you can send this to a person in Teams via a message, email it to one or more people or groups, add it as a task in Planner, add the data to an Excel table in a spreadsheet, or even post it to Twitter. You are mostly limited by your imagination.
At this point, you want to save and test the flow.
I know this seems like more work than just creating a report, adding a tile to a dashboard and using that to trigger an alert, and initially, it may be. But now you can see that the entire alert process is in one place - a single flow. You do not need a dataset, report, dashboard, alert, and flow like you do with the Power BI Alert solution.
And once you’ve done this a few times, you will realize this makes a good template for future flows. Since discovering this pattern I have deleted half a dozen Power BI reports that were nothing but record monitoring report, making my Power BI environment a bit cleaner. It is also easier for the user. They don’t have to click on links to see the actual error recorded. They are there, with the alert, in Teams, the email, or however you have chosen to send the alert.