
Return Row Based on Max Value From One Column when Grouping
/When you group data in Power Query, you are able to do a number of aggregations, like count, sum, min, max, etc. The problem is each of those aggregations only operate on that column. Let me show you what I mean. Suppose you have this data:

The Data
You need to return a table to the DAX model (or an Excel table) that only has one record per product, and you want the latest date, and the sales person associated with that date. So for product A, it is June 18, 2020 and Suresh, for B it is June 14, 2020 and Ana, and so on.

The Goal
If you do a Group By in Power Query and group on the product, then select the Max aggregation for the date and sales person, with the Group By dialog box configured as shown below, you get the following table:

The first row is correct, but that is just a coincidence. The max value for that row for product A is “Suresh” because that is alphabetically the highest name, starting with the letter S. The second row though you can see is wrong. It picked up Sally, the last name alphabetically in the Sales Person column. Sally is not associated with the June 14 record though, Ana is.
So, how do we fix this? There are two ways. Let’s do the long way. First, change the group by dialog box by removing the Max aggregation for the name and replace it with the All Rows aggregation as shown. It will return a new column called “All Rows” that has a nested table.

Looking at the image below, if you click to the right of the word Table you can see at the bottom of your screen the contents of that field. Do not click directly on the word Table itself as that will cause the table to expand. If you do that, just delete the last step Power Query generated to get back to this view. You can see below it has all 3 sales records for product B, and we want to return Ana.

You need to add a new column at this point, so go to the Add Columns tab and add a new column. Enter this formula:
= Table.Max([All Rows], "Sale Date")
Table.Max will take the table you give it, which is [All Rows] in this case, and return the record that has the maximum value for the field you specify, which is “Sale Date'“. You now have a new column that will have the word Record in yellow. You can see the formula at location 1 below. If you click to the right of it on the Product B row (2), at the bottom of the screen you will see it returned the June 14 record and has Ana’s name (3). We are getting there!

Now just click the Expansion icon in the upper right of the “Max Record” field and select Sales Person.

Now each product record has the correct sales person that corresponds to the latest sales date. At this point, just remove the All Rows column and change the data type of Sales Person to text.
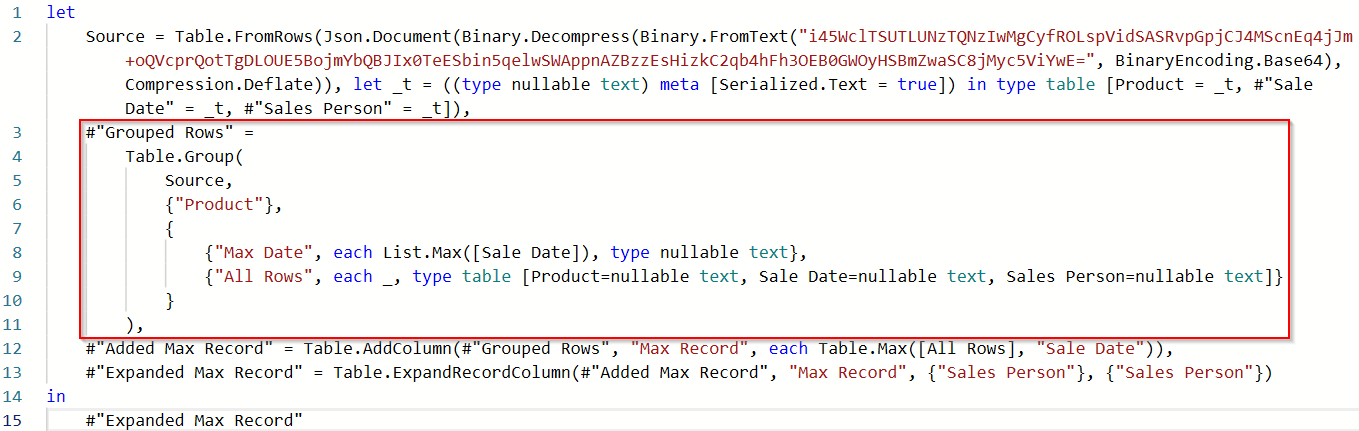
But that is 6 steps. Why can’t we do this in a single grouping step and radically cut down all of the extra steps? We can! But that requires a bit of manual M code. Let’s see how that works. First, let’s take a look at the entire M code for what we just did through the expansion of the final record:
You can ignore the Source line. That is just how Power Query stores data when you use the Enter Data function. I pasted the data in from Excel vs linking directly to Excel so I could share the PBIX file with at the bottom of this post.
The second step is “Grouped Rows” and I’ve circled that in Red. I added a lot of line feeds and indentation to make it easier to read. Remember, it isn’t M code unless it is formatted. What we are interested in is what starts on line 9 that is marked “All Rows.” This is how that nested table gets built. We don’t want the nested table though. We just need someone’s name. So, that little bit of code is as shown below:
{"All Rows", each _, type table [Product=nullable text, Sale Date=nullable text, Sales Person=nullable text]}
What this is doing is saying for each “_” return a table. What does that mean though, the “each _” part? Well, if you want to do a deep dive, you can read more about that at Ken Puls site. For our purposes, the _ character is a temporary variable that stores the entire table for for the current grouping being passed by the Table.Group function, which is at the Product field level. It is the same as:
{"All Rows", each _}
The rest of the statement is just classifying the table fields. If you want to go down that rabbit hole, be my guest. You will see though that we don’t need that table formatting. What we want to do is take that temporary _ variable with our table in it, and return the right sales person for the maximum date. All we have to do is wrap the variable with Table.Max, as follows:
{"All Rows", each Table.Max(_, "Sale Date"), type table [Product=nullable text, Sale Date=nullable text, Sales Person=nullable text]}
Now, instead of a nested table, we’ve jumped straight to the single record we want within the Table.Group function, as shown below. Now we just need to get the sales person’s name.

To get a single value from a field in a record, just append the field name in square brackets, as follows:
{"All Rows", each Table.Max(_, "Sale Date")[Sales Person], type table [Product=nullable text, Sale Date=nullable text, Sales Person=nullable text]}
Our final tweak will be to rename the “All Rows” field to “Sales Person”, then get rid of the table format code. That leaves you with this very short statement below. You’ll notice that instead of the type table with the field formatting, I told it to just set this value to text.
{"Sales Person", each Table.Max(_, "Sale Date")[Sales Person], type text}

That’s it. The table above is what is returned, and you’ll see that Ana was properly returned for product B. Just set the Sales Person data type to text, and you are done. The full M code is below. You’ll notice that there are only two steps here, the Source step, and the Table.Group step.

The beauty of this is, let’s say you have four columns you need to pull out this way, perhaps including the sales person’s last name, the region, and their commission rate. With the long method above, you have to add a new column with the Table.Max function, then extract the field you need, then expand the record for each one. You’d be well over 20 steps for the entire query.
With this method, you just keep adding columns to the Table.Group function, like this:
{"Last Name", each Table.Max(_, "Sale Date")[Last Name] type text},
{"Region", each Table.Max(_, "Sale Date")[Sales Region] type text},
{"Commission Rate", each Table.Max(_, "Sale Date")[Commission Rate], Percentage.Type}
That is still just two steps! I have confirmed this runs much faster than the multiple step process. I came up with this when I had a 20K record table that I thought was taking way too long to finish. This updated method took a fraction of the time, it just required a bit of work on my part.
I hope that helps you. The entire example can be found in this PBIX file.