
Tips for Debugging your DAX Code
/When trying to get your DAX measures to work correctly, there are a number of tools you can use to debug, which I will briefly mention, but not go into depth on. Instead, this post is about how to think about debugging your code. I am focusing on DAX here, but many of the methods would apply to any type of code.
First, the tools you can use. This is not a comprehensive list, just something to get you started.
Use Variables. Variables have several benefits:
Variables are processed one time and can be reused later in the measure in multiple places. This can speed up your code.
You can return a variable result to the visual itself. This allows you to see what each component is doing to ensure each part is calculating correctly.
CONCATENATEX - If a variable returns a table, you cannot return that variable directly to the visual. A measure requires a scalar (single) value. CONCATENATEX will convert a table to a scalar value so you can see everything in that table. You can also use the newer TOCSV or TOJSON functions, which do similar work different ways. TOCSV and TOJSON are the underlying functions that help EVALUATEANDLOG return results, and aren’t really meant to be used in a production model, but they are handy in debugging.
EVALUATEANDLOG - This is a relatively new function that will generate a ton of output for each expression you wrap with this function. There is a massive 4 part series on EVALUATEANDLOG here, including links to download the free DAXDebugOutput tool that will be necessary to read what this function returns. Note: Be sure to remove EVALUATEANDLOG once you are done. It will slow your code down. You should never publish a report that has this function in it.
Tabular Editor 3’s Debugger - This is simply the luxury vehicle for debugging DAX. More about this tool is here.

Instead of an in-depth look at these tools though, I want to look at the thought process when debugging and offer some tips.
First, when debugging DAX, be sure to do it in a Table or Matrix visual. You need to be able to see what numbers are being returned for each value in the columns and rows. This is impossible to do efficiently in a bar or line chart. To quickly convert your visual to a table or matrix, make a copy of it in Power BI, then while it is selected, select the Table or Matrix visual icon in the Visualization Pane. You might need to move fields around to get the correct fields in the Rows, Columns, and Values section.

Next, make a note of any filters you have set in the Filter Pane, then clear or remove them. You need to understand what the core calculation your measure is doing before any filters are applied. This may not be the result you want, but you have to start with the unfiltered result. For example, you might only be interested in getting an average 12 months of sales for Texas, but if the [Average 12 Months of Sales] measure is wrong at the global level, having your report filtered for United States is only muddying the issue. Make sure that figure is correct globally first. Then you can apply filters. If you apply the United States filter and Texas is still wrong, it is possible your measure is fine, but you have a problem in the data. Zip codes are assigned to the wrong state for example. But you will never figure that out if you have no confidence the measure itself is correct. When debugging DAX measures and queries, we take for granted that our data is good. That isn’t always the case, so keep that in mind.
We’ve all built reports where we create 3-4 measures, then create several measures with new logic and include those original measures. and before you know it, you have 40 measures with a complex web of dependencies. And the measure you are debugging references 8 of those measures.
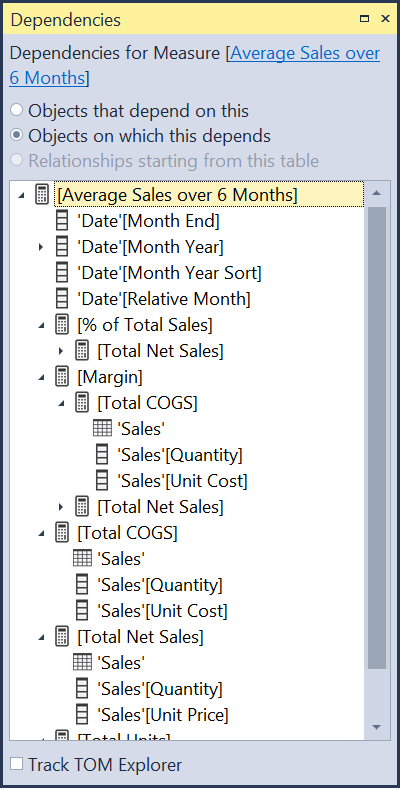
dependency view from Tabular Editor
As you can see above, a single measure can have many, perhaps dozens, of fields and measures it is dependent upon. When this happens, I generally tear down the measure to the component parts, even replicating code from other measures into the one I am debugging. Often I find some code in one of those dependencies that works great for that particular measure in a specific chart, but it doesn’t work well when used inside of your measure. Context Transition can be invoked at the wrong granularity (subtotal or total level) and return undesirable results, or it has a particular filter applied or removed using CALCULATE. Start simple, and rebuild it. Once you get it working, you can replace the duplicated code with the measure it came from. Sometimes though you might find your new code runs much faster. Iterators like SUMX and AVERAGEX often benefit from streamlined code vs using measures. As already noted, using measures in iterators can produce undesirable results at the total level. Look at these two examples:
Average Sales per KG = AVERAGEX(Sales, Sales[Units] * Sales[Price] / RELATED(Products[KG]))
Average Sales per KG = AVERAGEX(Sales, [Total Sales] / [Total KG])
If you put both of those measures in a table and it is by invoice number, they will both produce the correct results at the detail level. However, the second example that uses measures will not produce correct results at any sub-total or grand total level. It will total the sales for the entire table then divide that by the total of the kilograms. A useless result. (Ignore I am using the / symbol vs DIVIDE(). I am going for clarity here, not best practice.)
So here, reusing measures actually cause a problem. That is not often the case. I am a huge fan of reusing measures, but it isn’t always the answer, and can make debugging more challenging. Never assume your dependent measures are correct, or at least correct for your current needs.
Next, take a step back and try to understand the question being asked. Have the question phrased in plain business language. For example, here are two ways you can be presented with a question from a user for the report:
I need to get the total sales where the Relative Date is 0 through -7.
I need to get the total sales from today going back 6 days.
Those are not even the same question, and there are several ways to interpret #2.
You’ll notice in #1 that is a range of 8 days. So if you are getting that type of request from a user or co-worker, you might not think to push back, Instead you may give them a simple measure with a filter predicate like ‘Date’[Relative Date] <=0 && ‘Date’[Relative Date] >= -8. That filter is correct, but it likely answering the question in the wrong way.
When the person says “today going back 6 days” what does “today” mean? Today’s calendar date, or the latest date in the model, which might be a few days ago. Using TODAY() in a measure and then walking back 6 days will give the most recent 7 days, but the last 2-3 days might have no values if there are weekends or holidays involved. That might be correct. It might not be.
The point is, understand in plain English what your user is needing in the visual. Then you can start to craft the code to return that value. But if they start talking all DAXy to you, you might be debugging the wrong logic.
Do it in Excel first. Or have the user do it in Excel. Sometimes pointing directly to cells will allow you to understand the logic. You can rarely convert Excel formulas to DAX, but once you understand the logic of what is happening, writing the DAX becomes much easier. And you will also have the benefit of the correct answer in Excel you are trying to match.
You can also write it out on paper, or better yet, if you are on site, use the biggest whiteboard you can find and draw the logic out there.
Sometimes you just need to a break. Go for a walk. I have solved tons of problems a few miles from home on my morning walks. Staring at the same code can reenforce that bad code in your head and you cannot see a way around it. Stepping away removes that barrier.

Ask for help. I cannot stress this enough. Innumerable times I’ve asked for help and in just talking through the problem, I find a new path myself without the other person haven spoken a word. Some people call this “talking to the rubber duck.” Put a rubber duck on your desk and when you get stuck, tell the duck what the issue is. Just talking out loud you have to go much slower than thinking through it, and that alone helps.

Of course, asking someone can reveal the answer or a path forward. Ask a co-worker. Many organizations have Power BI or data analytics groups in Teams, Yammer, Slack, or other collaboration tool. Don’t be afraid to jump in with the question or ask for a meeting where you can do a screen share. I have helped others that had super basic questions a new person to Power BI would ask, and I’ve been on 2-3 hour screen shares where I and a co-worker untangled a gnarly problem. Sometimes it was my problem, sometimes theirs.
There are also the public forums, like the Power BI Community. It is especially important in those communities to give adequate sample data in a usable format - CSV or XLSX, and a mock up of the desired results. Don’t take shortcuts with your question. The people you are talking to know nothing about your scenario, so where you can take shortcuts with your co-workers that know the data and the company, forum members don’t. So carefully explain the issue.
One of the latest fads is to ask ChatGPT. That is ok as long as you don’t trust the code for the correct answer. I’ve found ChatGPT doesn’t always return code that even works, let alone code that returns an accurate result. However, it can help directionally, and suggest functions, or different ways to shape and filter the data you might not have thought of.
Regardless of where you might get an answer, verify it is correct. It may return a number, but verify it is the correct number.
Hopefully the above tips will help you rethink how you approach a problem you are stuck on. Of course, learn the debugging tools and techniques mentioned above. The best time to learn those tools is when you don’t need them. Have a complex measure that already works? Awesome. Throw a table visual with that measure into Tabular Editor 3 and see how the debugger works, or wrap some of the variables in EVALUATEANDLOG and see what the DAXDebugOutput tool generates. Then when you do have a problem the output from these tools will be familiar to you.