Always Use Explicit Measures - Wait, What Is An Explicit Measure?
/All of your analytics in Power BI are done with measures, and there are two ways to create measures. It is important to understand the difference between the two methods. If you drag a field from the data pane directly into a visual, that is an implicit measure. The model usually wraps it with SUM(), but other aggregations are possible, like COUNT() or AVERAGE().
Creating an implicit measure
In the above image, I am dragging the Profit field to the table, and Power BI is using the SUM() aggregation. The query Power BI uses to actually generate this table visual is below:
Implict measure in the DAX query
You can see it wrote SUM(‘financials’[Profit]) and wrapped it with CALCULATE(). That CALCULATE() is important later. Side note: If you’ve ever heard someone say they don’t use CALCULATE() in their reports, that is just nonsense. Whether you use the CALCULATE() function in a measure or not, Power BI uses it all of the time.
An explicit measure is when you explicitly write a measure using the DAX functions you need. For example, Total Profit = SUM(‘financials’[Profit]) is an explicit measure. Once created, I would then drag [Total Profit] to my visuals. The DAX query when using an explicit measure might look like this:
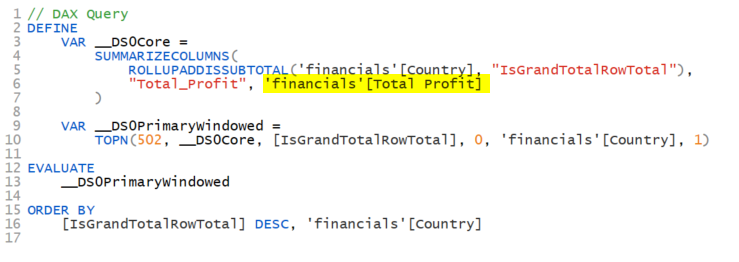
Explicit measure in a DAX Query
Here it is using the [Total Profit] measure. Notice there is no CALCULATE() function in the query. That is because when you refer to a measure, there is an implicit CALCULATE() already. It is as if the above said CALCULATE(‘Financials’[Total Profit]). Got it?
When you use an explicit measure, the DAX query for your visual will have an implicit CALCULATE().
When you use an implicit measure, the DAX query for your visual will have an explicit CALCULATE().
Don’t worry. That is as complex as this article gets.😉 It just helps to understand what goes on under the hood.
Note that Power BI always puts the table names in front of measures within the queries it generates. This is a bad practice for you and me. Never do this when writing measures, calculated columns, or calculated tables. The rule is:
When referencing a measure, always exclude the table name.
When referencing a column, always include the table name.
What Power BI does when building its own queries is its business. You’ll need to understand how to read the code, and you can see in the query above it appears it is referencing a Total Profit column, but it isn’t. Ok, enough of that tangent.
So, what difference does it make whether or not you use implicit or explicit measures? Here are the differences:
Advantages of implicit measures:
Easier when adding a field to a visual.
Disadvantages of implicit measures: (not comprehensive)
You cannot edit the measure in order to change the calculation. Say you had dragged in the ‘financials’[sales] field into a measure and it created the implicit SUM(‘financials’[sales]) measure, you cannot change it, other than the aggregatio type (COUNT, AVERAGE, etc.) If you need sales to be the net sales calculation by subtracting cash discounts, you cannot. You now have to write an explicit measure that might look like Net Sales = SUM(‘financials’[sales]) - SUM(‘financials’[cash discounts). Now you will need to remove your implicit sales measure from any visual that was using it and replace it with the new business logic. That is a lot more work than just editing an explicit measure had you created one in the first place. Be kind to your future self.
This particular problem magnifies itself if you have added conditional formatting to that field. Once you swap out the implicit measure with an explicit measure, you have to redo all of the conditional formats!
You cannot build off of it. The beauty of measures is you can create new measures that use other measures, and if you change the original measure, the dependent measures will automatically take in that new logic.
Implicit measures do not work with Calculation Groups.
The Calculation Group thing is HUGE. What is the problem here?
I’m not going to do a deep dive into Calculation Groups. Others have already done a fantastic job here, so go read their blogs.
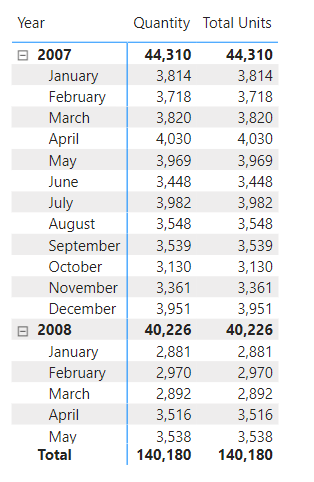
Consider the following visual. It has two measures.
The Quantity column is an implicit measure. I just dragged the Sales[Units] field into the visual and called it Quantity. The Total Units column is the explicit measure Total Units = SUM(Sales[Units]).
Now, I want to have another set of columns that will show me the units in the same period last year. I could create a new measure for this, or I could use a Calculation Group. The latter is more versatile, so I’ll do that. Using Tabular Editor I created a Time Intelligence Calculation Group with Current Period and Prior Year Calculation Items. Here is the full DAX for how that will work. Again, this isn’t an article to teach you how to create Calculation Groups. I’m focused on the downsides of implicit measures.
Logic in the Calculation Group
When I drop that Calculation Group to the Column section of the matrix, I get this visual:
Do you see the problem? The Current Period columns are fine. But look at the Prior Year columns. The Quantity column is showing the same as the Current Period. That is wrong. But the Total Units measure correctly shows the units from the prior year. Why is that?
It is the SELECTEDMEASURE() function in the Calculation Items shown above. That is how Calculation Groups work their magic. They have but one flaw. They cannot see implicit measures, so they ignore them. Power BI protects you from this though. When you create a Calculation Group, the model flips a switch that blocks the creation of additional implicit measures. Notice the DiscourageImplicitMeasure property. By default this is set to FALSE, but when you add a Calculation Group to a model, it gets set to TRUE.
Discourage Implict measures enabled
Now if you drag a field to a visual expecting a quick calculation, you won’t get one. It will either just show the values in that field, or block you from adding it to a visual outright. The property is called “Discourage Implicit Measures” and not “Block Implicit Measures.” The reason is the tabular model cannot foresee all possible third party clients working with the model, but for Power BI Desktop or writing a report in the service, it is a block.
So we’ve seen implicit measures are fast and easy to create, but have a number of shortcomings. I know it takes an extra 30-45 seconds to create an explicit measure, but trust me, creating explicit measures is a best practice. It will save you additional work in the future, and if you introduce Calculation Groups to your model, will help ensure they are returning the expected results.


