
Group By In Power Query When Data In Column Changes
/If you’ve used Power Query long enough, you’ve needed to group data and provide some sort of summary. For example, grouping by customer and summarizing sales. The normal way the Table.Group function works is to group the entire table by the field(s) you are grouping by, then providing whatever aggregations you need.
However, you can alter that behavior and group data by a column, and have it provide a separate group at each change in the data. Let me illustrate using some data a user posted in the Power BI forum:
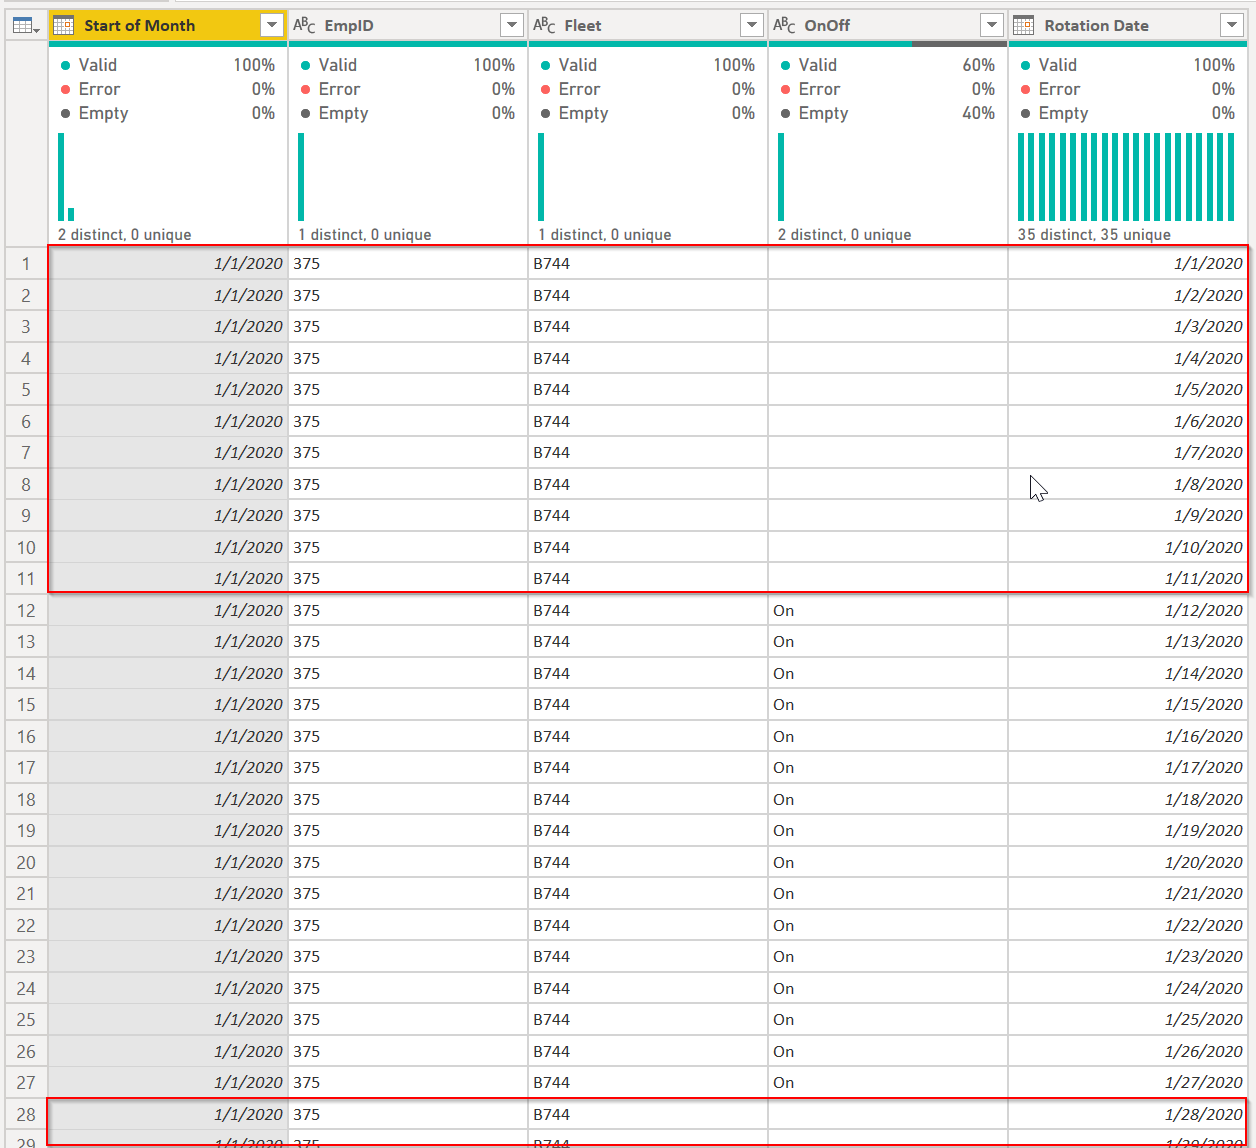
They wanted to find the start and end date of each section in the OnOff column. So in the first group, the start and end dates would be 1/1/2020 and 1/11/2020. The On periods would be 1/12/2020 and 1/27/2020. Then, the next blank section would start at 1/28/2020
A normal grouping would look like this in Power Query:
Select the OnOff column and press Group By in the ribbon.
Add a new column called AllRows and use the “All Rows” operation.
Group By will return the table shown. OnOff has two values, blank and “On” and then two nested tables.
If you click on the small white area next to the yellow word “Table” you can see what is in that nested table in the bottom view. It has all records, or all rows, for the blank value. As you can see, there is no way this way to separate the first period that ends 1/11/2020 with the start of the next period on 1/28/2020.

The formula that is generated by Power Query uses Table.Group, and it looks like this:
= Table.Group(#"Changed Type", {"OnOff"}, {{"AllRows", each _, type table [Start of Month=nullable date, EmpID=nullable text, Fleet=nullable text, OnOff=nullable text, Rotation Date=nullable date]}})
If you look at the documentation though, for Table.Group you will see the 4th parameter is an optional setting called groupkind. It then proceeds to give you no info on what that means. If you search around a bit, you will find two settings that might work. One is GroupKind.Global, and the other is GroupKind.Local. Looking at the documentation for these two provides absolutely no help.

Well, that why I am writing this. I learned about this several months ago but forgot it. If you looked at the Power BI Community thread above, you’ll notice I did the Excel thing:
Bring in one of the columns into the table but offset by one row
Do some if/then analysis to determine when data changes
Do a grouping
Get the start/end dates.
But Jimmy801 posted the more elegant solution, reminding me of this optional and rarely used parameter, and that is the main reason for this blog post. To remind me of this parameter. 😁
By default, Table.Group uses GroupKind.Global as the 4th parameter. It scans the whole table and groups by each distinct value in the grouping columns, the OnOff field in our example. However, add GroupKind.Local to the function as shown below: (I’ve added line breaks for readability) and you’ll see a very different table:
Table.Group(
    #"Changed Type",
    {"OnOff"},
    {{"AllRows", each _, type table [Start of Month=nullable date, EmpID=nullable text, Fleet=nullable text, OnOff=nullable text, Rotation Date=nullable date]}},
    GroupKind.Local
    )

Now, every time the OnOff field changes, it does a grouping. So in the sample data, there are two sections that are blank, and two that are “On” and you can see that in the first blank section, it correctly shows 1/1/2020 through 1/11/2020. You can then use the Table.Min() and Table.Max() functions to get the start and end dates from each local grouping, and finally re-expand the necessary columns from the AllRows field.

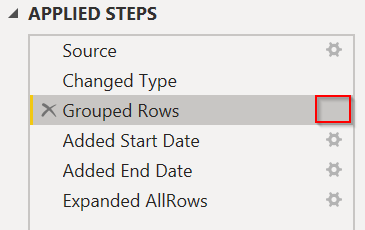
The only caveat here is once you add the GroupKind.Local parameter, the little gear icon next to the Grouped Rows step goes away and you can no longer alter the grouping using the Group By dialog box. You would either need to edit the M code manually, or remove GroupKind.Local, then edit the group settings, then add GroupKind.Local back to the formula manually.
You can see the full PBIX file here or paste the full M code below in to a blank query of your own to play with.
let
    Source = Table.FromRows(Json.Document(Binary.Decompress(Binary.FromText("jdOxDYMwGEThXVwj2b7f4KTNAhkAsQL7l1iCQ1TJkyy78Nc93bqmmmtWUUlTij6P+9NbG88499c2/XGCLqBr0M3QLdB16F7QvaGrhUJQ5LufFEQxBV1MQRpTUMcUBDIFjUxBJlNQ6qICrUx5LfFa4rXEa4nXEq8luijRSYluKnineHTSL6rMpbAMLJ1zOwA=", BinaryEncoding.Base64), Compression.Deflate)), let _t = ((type nullable text) meta [Serialized.Text = true]) in type table [#"Start of Month" = _t, EmpID = _t, Fleet = _t, OnOff = _t, #"Rotation Date" = _t]),
    #"Changed Type" = Table.TransformColumnTypes(Source,{{"Start of Month", type date}, {"Rotation Date", type date}}),
    #"Grouped Rows" =
        Table.Group(
            #"Changed Type",
            {"OnOff"},
            {{"AllRows", each _, type table [Start of Month=nullable date, EmpID=nullable text, Fleet=nullable text, OnOff=nullable text, Rotation Date=nullable date]}},
            GroupKind.Local
            ),
    #"Added Start Date" = Table.AddColumn(#"Grouped Rows", "Start Date", each Table.Min([AllRows], "Rotation Date")[Rotation Date], type date),
    #"Added End Date" = Table.AddColumn(#"Added Start Date", "End Date", each Table.Max([AllRows], "Rotation Date")[Rotation Date], type date),
    #"Expanded AllRows" = Table.ExpandTableColumn(#"Added End Date", "AllRows", {"Start of Month", "EmpID", "Fleet", "Rotation Date"}, {"Start of Month", "EmpID", "Fleet", "Rotation Date"}),
    #"Reordered Columns" = Table.ReorderColumns(#"Expanded AllRows",{"Start of Month", "EmpID", "Fleet", "OnOff", "Rotation Date", "Start Date", "End Date"})
in
    #"Reordered Columns"